FULLTEXT: PDF HTML REFERENCE: BibTeX EndNote DOI: 10.1109/SocialInformatics.2012.48
Socialize or Perish
Relating Social Behavior at a Scientific Conference to Publication Citations
Mathias Funk, Jun Hu, Matthias Rauterberg
Department of Industrial Design
Eindhoven University of Technology
Eindhoven, The Netherlands
{m.funk, j.hu, g.w.m.ruterberg}@tue.nl
Abstract— scientific progress depends on communication and exchange of ideas. Among others, scientific conferences are considered to be the primary venues for connecting with fellow scientists. Would those who are more active in the conference have more impact in terms of the citations today? In this paper we present an analysis of human behavioral data collected at a scientific conference by means of SpotMe devices distributed to the participants. These handheld devices allow conference participants to connect to others, receive alert once others are in the proximity, and to send messages. We complement the behavioral data gathered at the conference with measures of scientific productivity over nine years following the conference, and draw conclusion out of this joint data set. It is confirmed that social activity during the conference is significantly correlated with citation counts for full papers.
Index Terms—Behavioral data analysis; scientometrics; social interaction analysis
I. Introduction
Scientists have been and will be social creatures; scientific progress depends on communication and exchange of ideas. While many years ago written communication such as notes and letters between scientists were the primary way to connect, the mobility achievements of the 20th century brought face-to-face meetings such as scientific conventions, workshops, conferences, and symposia to great prominence. Nowadays, scientific conferences are considered to be (among) the primary venues for connecting with fellow scientists, and human behavior being partly determined by the social network [1], scientists are clearly not an exception.
Scientific conferences are highly structured events, enduring often several days, to fit an extensive program of presentations (often organized in tracks), workshops, and social events. During these conferences, the participants take the opportunity to socialize with the others formally or informally, which is often the argument for why to take part in such events. One would expect that those who are more active in socializing with others will have more positive impact on their scientific career later on.
In this paper we analyze quite unique behavioral data that has been collected at INTERACT’03 - an important scientific conference in the field of Human-Computer Interaction in 2003. This conference was held for 5 days and 402 participants attended the different sessions and conference activities. With their consent, 343 participants of the main conference were invited to receive a SpotMe device (www.spotme.com), which they could use throughout the conference for spotting, messaging, and connecting with other participants. The devices offered also possibilities to interact with presenters, receive broadcast from the organizers, and access the conference schedule. Participants’ contact details were stored on the devices for quick access and exchanging of virtual “business cards.”
Researchers have been aggregating the data from social activities and relating the data to the success of the participants of these activates that may or may not directly been targeted as the goal of these activities. Pentland (2008) suggests the communication channel revolves around the social relations and in the social activities “influences major decisions in our lives even though we are largely unaware of it” and by making use of this communication channel consciously or unconsciously one can become more successful in achieving direct results or in one’s career [2]. In their research a “socialmeter”, a wearable electronic sensor is used to aggregate tone of voice, amount of speaking and listening, and back-and-forth patterns of signaling among groups of people.
Would the social activate of the participants of a scientific conference influence their decisions in referring to each other work in their publications later as Pentland suggested? The data collected in 2003 give us an opportunity to get a glimpse into the social behavior of the participants, and during the 9 years of time up to today, the citations to their papers would have been stable enough to show the impact. Do those papers whose authors were more active in the conference have more impact in terms of the citations today?
The work presented in this paper relates social activities in the context of a scientific conference with scientometric data. Next we will give more information about first the SpotMe device and related work, and then the study we conduced based on the data collected from the conference, followed by discussions on the results.
II. SpotMe and related work
SpotMe (see Figure 1a) is a handheld communication device and service developed by Shockfish SA, Lausanne, Switzerland, from 2001. The device allows participants of larger meetings such as conferences, symposia, and other professional events to easily network and share their contact details (Figure 1b). The device runs an embedded Linux and communicates with other devices via RF and IR connectivity. Most interestingly, SpotMe supports near-field communication–also called “radar”–such that users in close proximity can “spot” each other. The device supports following functions:
Database of the participants provides the list of all the participants that can be browsed through or used for search for a particular person.
“Radar” displays the photos and details of all people standing up to 30 meters away.
“Spot” notifies the user when a targeted person is close by within 10 meters.
Messaging provides the functions similar to Short Message Service for mobile phones, but among the SpotMe users.
Electronic business cards can be exchanged through infrared communication.
Agenda keeps the users updated with the event program.
Figure 1c shows the graphical user interfaces of some of the above functions.
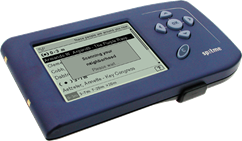
a. 2003 version used at INTERACT’03
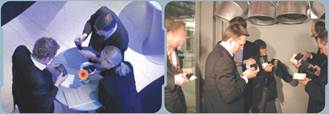
b. Users of SpotMe at meetings
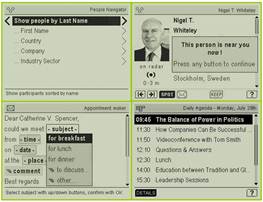
c. GUI of SpotMe
Figure 1: SpotMe (pictures taken from the SpotMe Brochure distributed at INTERACT’03)
As stated earlier, the scientific conference, whose participants used SpotMe devices, took place about 9 years ago. The version of the SpotMe handheld device was since replaced but newer version – and now by an iOS app running either on personal or SpotMe-supplied hardware. Obviously, data available for analysis in this paper corresponds to the state of the art about 9 years ago. SpotMe and similar devices have been used in various contexts to investigate the social behavior, but also movement and interaction patterns of people in relatively open settings such as conferences, events, and large-scale field studies. Some of these devices operate on Bluetooth profiles [3], such as SocialSense [4] which provides additional social information about people nearby by means of pulling and displaying public profiles of people recognized by their devices. Another project aims at sharing space-time trails [5] via a companion website to which location and sensor data are communicated. A paper by Counts and Geraci (2005) about physical co-presence at events reports on four experiments testing a digital link-back targeting event participants for sharing social events in a social networking software [6].
Other technologies than Bluetooth are also employed, such as with IntelliBadge, an RFID based system that tracks event participants and provides them with location-based services [7]. UberBadge is another badge system to be used at large professional events such as scientific conferences to study human dynamics [8]. The papers mentioned above refer explicitly to SpotMe as a “similar device”. Both badge-type of systems differentiate from SpotMe in the physical form and affordances, and allow for a more implicit use than with a hand-held device such as SpotMe. The other related devices differ in terms of services provided and service channel such as companion websites and public displays in connection with tracking devices, e.g. AutoSpeakerID and Ticket2Talk [9, 10]. The authors argue that SpotMe as a handheld device can enrich the conference experience, but is less proactive than a public display. Finally, the use of a system like SpotMe might have also an impact on the acceptance of a conference. Research by various groups suggests that connecting participants during a conference helps in “participant retention” over time [11-20].
We are more interested in the investigation of direct links between scientometrics and human behavior at scientific conferences and other professional events. A strong effect between the social behavior during and after presentation of scientific results, and the actual resulting amount of citations (as an indirect measurement of relevance and popularity of presented results) can be assumed. Therefore, the research presented in this paper strongly relates social activity as measured by SpotMe devices in the context of a scientific conference with scientometric data obtained from analyzing data from the conference proceedings.
Not only the entirety of data might yield interesting results, different paper types are even more interesting in terms of significantly different impact as a related analysis of conference proceedings done by Bartneck and Hu shows [21]. The scientometric data set can be clustered: the SpotMe data contains different classes of interaction between users that can be weighted against citations of different paper types. While some interactions are directed and stealth (e.g. being alerted when a certain person comes into a radius up to 30 meters), others are openly involving the face-to-face interaction (e.g. exchanging business cards).
This research aims not only at insights for conference participants, how to best act and which actions to avoid at scientific conferences, but also research by Henderson et al. (2009) suggests multiple strategies for conference organizers to maximize the bibliometric impact, among which are devices stimulating networking and communication such as SpotMe [22]. This is even more relevant as our research presented in this paper investigates whether certain interactions with certain peers at a conference might pay off in terms of citations.
III. Study
As indicated by the related work shown above, scientific conference as professional events are prominent venues for discussion, networking, and in the end preparing and conducting joint research activities, from exploring the current state of art, informing oneself about recent findings and spotting emerging trends. Presentation of work and reception of works of other and further elaboration thereof in personal communication is crucial for the advancement of science, and last but not least a major stepping-stone for academic careers.
The study presented in this paper is unique in the sense that it connects social interaction, communication and symptoms of networking during INTERACT’03 with bibliometrics obtained from the conference proceedings [23], namely the citation counts of the conference papers. The citation counts per paper were obtained manually using the paper title and author names in Google Scholar (scholar.google.com) queries as this proved to be the best approach for reliable citation counts. As an example, the paper
M. Rauterberg, M. Janse, and P. Vinken, "User-System-Interaction Design Program: an Overview," in INTERACT'03, Zurich, 2003, pp. 1069-1070.
is searched using a strict title and author matching string as following:
"User-System-Interaction Design Program: an Overview" author:Rauterberg author:Janse author:Vinken
Our assumption is that certain social activities of conference participants using SpotMe have an impact on the citation counts of their papers which will receive later on. So our null hypothesis H0 is:
H0: Social activities by the authors using SpotMe at INTERACT’03 do not matter for the citation counts of their papers later on.
The proceedings of INTERACT’03 included in total 224 publications of which 84 are full papers, 62 are short papers. The rest (in total 78) included summaries or abstracts of posters, panels, demos, keynotes, doctorial consortium, as well as introduction to HCI organizations and Special Interest Groups. Before acquiring the data and analyzing it we assumed differences between different types of papers, e.g. full, short and the rest, since full papers have usually more impact than short ones. An analysis of the ACM CHI proceedings by Bartneck and Hu (2009) supports this ([21], p.703 in the proceedings) : “The bibliometric analysis shows that the papers in the main proceedings (mean = 40.167) are significantly (F(1,6295) = 308.253, p < 0.001) more cited than the papers in the extended abstracts (mean = 11.917).” Taking this into account the null hypothesis needs to be refined for the three different types of papers – full, short, and the rest of the papers – as H0F, H0S, and H0R respectively.
H0F: Social activities by the authors of the full papers using SpotMe at INTERACT’03 do not matter for the citation counts of their papers later on.
H0S: Social activities by the authors of the short papers using SpotMe at INTERACT’03 do not matter for the citation counts of their papers later on.
H0R: Social activities by the authors of the other papers using SpotMe at INTERACT’03 do not matter for the citation counts of their papers later on.
IV. Method
In the analysis we relate social interaction activities as observed by SpotMe devices during the conference in 2003 and the accumulated citations of the scientific papers presented at the conference. This became possible by combining paper author names with SpotMe user data. Naturally, not all paper authors were present at the conference and not all SpotMe users were actual authors, but given these sets a sufficiently large intersection subset can be obtained and used for investigation. The subset contained the data related to 213 publications (82 full papers, 59 short papers and 72 other papers). In the following, a detailed account of the used data is provided:
A. SpotMe data
The SpotMe data used in this research was gathered in 2003, and made available for use long after the conference. The SpotMe data files, each of which contains a table of comma-separated values, are equivalents of database tables, for instance, for messages sent or business card exchanges between different SpotMe users, which are identified with a unique system-wide ID. With the complete set of raw logging data, the particular mappings between different tables were reconstructed. Some of these tables can be linked by means of timestamps and participant identifiers. After this step, in which a preliminary database was created, the initial SpotMe data was matched against the overall list of conference participants to enrich the social interaction data by title (if given), institution, country, and gender. The resulting database forms the basis for the following analysis.
In the context of this analysis we focus on a subset of data available from the SpotMe devices, and therein, certain possible social interaction activities as explained below:
1. Looking for: Another participant’s name is entered and the device will alert the user with her name and photo if the looked-for participant comes close (a few meters (0-10m) radius). We distinguish the direction of interaction: person A looking for person B is different than person B looking for person A.
2. Spotting: After another participant’s name is entered and the device alerts the user (and show name and photo) because the looked-for participant comes close (inside a radius of 30 meters), a “spotted” event is logged. We do not distinguish the direction of interaction for spotting people as two directional but equivalent events are created upon a spotting.
3. Messaging: Participants can send short messages to other participants. While data allows to reason about the participants involved in a messaging event as well as the time the message is sent, the content of messages is not available due to privacy reasons. Also directionality plays a role in this mode of interaction. Sender and receivers of messages are distinguished.
4. Introducing: Participants can exchange their contact details stored on the SpotMe device. This interaction requires both participants involved in the exchange to be in close proximity. In this mode of interaction, directionality is not recorded, since the technical exchange of data is preceded by a verbal initiation and introduction.
The four different modes of interaction can be ordered by degree of contact needed: looking for people is the least intrusive activity and can be performed by person A without person B knowing about it. Spotting and messaging activities can be carried out by person A without actually meeting and talking to person B. Looking for and spotting is less active than messaging, as it can be a completely stealth activity. Messaging clearly involves the awareness of both persons, and introductions require even a face-to-face moment similar to traditional business card exchanges. A business card exchange, the fourth activity, can be seen as the most formal activity and it involves people being connected and residing in the same space.
B. Scientometric data
Participants of the conference (N=343) who could be matched in both the SpotMe data and the official participants list form the basis of the analysis in this paper (N=213). These names could be matched to the list of authors of conference papers in the official proceedings such that citation counts could be reliably obtained by querying Google Scholar with the exact publication title and list of authors. The queries were conducted on August 9, 2012.
C. Combining SpotMe and scientometric data
We correlate different metrics of SpotMe activity with a paper’s citation count, by looking at two groups given a particular paper P:
· Authors of the same paper P (AOSP): all authors mentioned in the authors section of the published paper, taken from the conference proceedings
· All other participants (!AOSP): all conference participants, authors of other papers or not, who are not among the authors of paper P
A paper has one or more authors who might or not be fully present at the conference. From the SpotMe data, the count of authors present at the conference could be derived together with the SpotMe interaction metrics as described above, in total 12 metrics per conference paper P plus its citations:
· Citation: the amount of citations paper, received after being presented and published, from 2003 onwards till 2012, measured by querying Google Scholar.
· AOSP present at the conference: subset of AOSP, including the authors present at conference and using a SpotMe device
· Messages sent among AOSP vs. !AOSP: amount of text messages sent from AOSP to AOSP vs. text messages sent from AOSP to !AOSP
· Looking for AOSP vs. !AOSP: Spotting alerts requested by AOSP for AOSP vs. alerts requested by AOSP for !AOSP
· Spotting AOSP vs. !AOSP: Spotting alerts received by AOSP for AOSP vs. alerts requested by AOSP for !AOSP
· Business card exchanges among AOSP vs. !AOSP: amount of exchanged business cards between AOSP vs. exchanges between AOSP and !AOSP
· Total amount among AOSP vs. !AOSP : total amount of the social interaction activities (messaging, looking for, spotting and business card exchange) among AOSP vs. the activities with !AOSP.
· Total amount of all: total amount of the social interaction activities by the authors of the same paper.
We also decided to split group the conference publications into three large groups: full papers (N=82), short papers (referenced as such in the proceedings, N=59), and all other publications as the rest (N=72): keynotes, doctoral consortium papers, posters, video papers, interactive experiences, tutorials, workshops, panels, organizational overview, HCI societies worldwide, special interest groups, and system demonstrations. According to the conference proceedings, 672 authors collaborated in total. Split by paper type there are 269 authors for full papers, 180 authors for short papers, and 233 authors for the rest. According to the data we collected, 302 authors of these papers participated in the conference, including 105 full paper authors, 81 short paper authors and 116 for the rest.
V. results
For the statistical analysis we will approach it in two steps: the first step is to test whether there are significant differences between the means of the citations in relation to the types of the paper (full, short, the rest), therefore, a one-way Analysis of Variance (ANOVA) is conducted. The second step is to test the hypothesis given in section III, so a Spearman’s rho test was done on the SpotMe data about social activities and the citation counts. Spearman’s rho was applied considering that all variables have an interval scale, the descriptive statistics in Table 4 - Table 7 in the appendix show that the variables are not normally distributed, and the correlation is expected to be monotonic and should not be sensitive to outliers. According to Bonett and Wright (2000) [24], the sample size requirements for the Spearman’s rho test are met.
A. Differences in paper types
The descriptive statistical summary of the citations, the number of the authors, and the authors actually participated in the conferences per paper type is shown in Table 1. One-way ANOVA was conducted to see whether there is a significant difference in the means of these variables. ANOVA indicates strongly that the null hypothesis of no differences in the means of the citations between the types of the papers can be rejected (F = 13.763, p < 0.001). In other words, ANOVA indicates significant differences: full papers tend to have significantly more citations over years than short papers; and the same difference can be observed between short papers and the rest.
ANOVA does not show significant difference in the number of the authors, but it does show significant difference in the number of the authors actually attended the conference (F = 4.791, p = 0.009). Interestingly enough, less authors from the full papers attended the conference than other types, although the difference in the means does not seem to be really big.
Table 1. Descriptive summary according to paper types
Paper type |
N |
Citations |
Number of authors |
Authors at conference |
|||
Mean |
Std. Dev. |
Mean |
Std.Dev. |
Mean |
Std. Dev. |
||
full |
82 |
29.13 |
42.822 |
3.22 |
1.839 |
1.28 |
.634 |
short |
59 |
12.22 |
35.888 |
2.95 |
1.916 |
1.37 |
.554 |
the rest |
72 |
1.78 |
4.098 |
2.96 |
2.624 |
1.61 |
.797 |
Total |
213 |
15.20 |
34.603 |
3.06 |
2.149 |
1.42 |
.686 |
B. Correlation of activity and citation counts
Spearman’s rho was conducted first on all the papers to see whether there is a correlation between the social interaction activities and the citation counts (Table 2). Only the number of AOSP present at the conference was negatively correlated to the citation counts (Coefficient = -0.177, p = 0.01). The coefficient is moderate. But the hypothesis H0 cannot be rejected, if we count in all types of the papers.
Table 2. Correlation of SpotMe activities with citations of all papers (N=213)
Coefficient |
p (2-tailed) |
|
AOSP present at the conference |
-.177 |
.010 |
Messages sent among AOSP |
-.085 |
.219 |
Messages sent to !AOSP |
.055 |
.422 |
Looking for AOSP |
-.080 |
.246 |
Looking for !AOSP |
.043 |
.528 |
Spotting AOSP |
-.081 |
.237 |
Spotting !AOSP |
.029 |
.673 |
Business card exchanges with AOSP |
-.033 |
.633 |
Business card exchanges with !AOSP |
.061 |
.375 |
Total amount among AOSP |
-.071 |
.300 |
Total amount with !AOSP |
.048 |
.486 |
Total amount of all |
.026 |
.707 |
At this point we suspect the significantly differed citation counts between paper types could indicate a different result for different paper types. Spearman’s rho was then conducted on all there paper types. No significant correlation between the social interaction activities and the paper citation counts were found for the short papers and the rest. Hence the null hypotheses H0S and H0R cannot be rejected. But interesting results were observed for the full papers (Table 3).
Table 3. Correlation of SpotMe activities with citations of full papers (N=82)
Coefficient |
p (2-tailed) |
|
AOSP present at the conference |
.100 |
.370 |
Messages sent among AOSP |
.199 |
.073 |
Messages sent to !AOSP |
.251 |
.023 |
Looking for AOSP |
.176 |
.114 |
Looking for !AOSP |
.248 |
.025 |
Spotting AOSP |
.174 |
.119 |
Spotting !AOSP |
.253 |
.022 |
Business card exchanges with AOSP |
.224 |
.043 |
Business card exchanges with !AOSP |
.182 |
.101 |
Total amount among AOSP |
.219 |
.048 |
Total amount with !AOSP |
.237 |
.032 |
Total amount of all |
.230 |
.037 |
For full papers, most of the SpotMe social activities with !AOSP are positively correlated with the situation counts, including “Messages sent to !AOSP” (Coefficient = 0.251, p = 0.023), “Looking for !AOSP” (Coefficient = 0.248, p = 0.025), “Spotting !AOSP” (Coefficient = 0,253, p = 0.022). “Business card exchange with AOSP” is also correlated with the citation counts (Coefficient =0.224, p = 0.043). Overall, no matter whether the social interaction is among AOSP or with! AOSP, or all together, the total amount of the social interaction activities is positively correlated to the citation count (Coefficient = 0.219, p = 0.048; Coefficient = 0.237, p = 0.32; Coefficient = 0.230, p = 0.037 respectively). The null hypothesis H0F, which assumes that there is no correlation between the SpotMe social activities and the citation counts of the full papers can be rejected, if we observe the total amount of activities or in specific categories of these activities.
VI. Interpretation and discussion
A. Differences in paper types
The results of the ANOVA on the citations according to the paper types show significant influence of the type of the paper on the number of the citations. Full papers outperform the other types and, in comparison, publishing one-page summaries of interactive demos or even keynote speeches have a much weaker impact in terms of citations. Even a short paper is better, for its content is more comprehensive hence more valuable for the others. Notice that this analysis does not yet take into account the social activities with the SpotMe device, which suggests that no matter how active the authors can be at the conference, the overall citation impact of a one-page summary in conference proceedings will have hardly the same impact as full or short papers. This might be obvious, but it indicates clearly that the authors should not expect higher citation numbers from the interactive demos and from the one-page summaries of the keynote speeches, although these conference activities are interesting for the participants and are valuable for a conference to attract participants.
No significant difference was found in terms of the number of the co-authors among different paper types. But it seems that the authors of short and other papers were more eager to show up at the conference. There can be many reasons to be speculated, one of which could be that the authors of the short papers are more motivated to show the community their work on progress, to get the feedback and input, and to establish their professional network [25, 26].
B. Correlation of activity and citation counts
The analysis of the correlation between the social interaction activities and the citations shows that only social interaction activities by the authors of the full papers matter. From all these statistically significant corrections in Table 3, one observes that most of the specific categories of SpotMe social activities with !AOSP, which means the authors spend their time on socializing with the authors of the other papers, has a positive influence on the number of the citations of the paper, except the activities in exchanging the business cards. Furthermore, the total amount of such social activities is correlated with the citation counts. It suggests that the authors of the full papers, who spend their time on socializing with others at conferences, will receive higher numbers of citations to their papers later on.
One of the reasons that other non-significant categories of the social activities in Table 3, especially those activities among AOSP, is that the number of the authors of the same paper present at the conference is very limited as shown in Table 1. With not more than 2 authors per paper present at the conference, there is not much of social interaction among them to be expected.
From the ANOVA results we have already found that the short papers and the rest are significantly less cited than full papers. From the Spearman’s rho test there is no correlation found between the social activities and the citations in these two types of papers. Short papers are usually shortened versions of originally submitted long papers, so we can assume that the actual amount of scientific content is roughly the same as with long papers, however the amount of the content to be received by the readers is less. As we know, correlation does not imply causation. However, one may speculate that no matter how active or inactive the authors are in socializing, if the papers do not provide enough content for sharing as full papers do, it simply does not matter, at least in terms of citations.
It is not to imply a causal relation between the social behavior of the authors and the amount of citations to their papers, as the selection of “good” researches as full paper authors is independent of their social behavior. However one may speculate that the full paper authors are more self-confident and therefore can easily approach others, and that they do have better language skills as shown in their papers and therefore they are less hesitant to contact others.
If we look at each type of the papers separately, the number of the authors of the same paper present at the conference has no correlation with the citations to the paper, no matter which type of the paper it is. Worse, if we put all the papers together, the number is negatively correlated to the citations as Table 2 shows. One might argue that more authors of the same paper participating in the same conference might help them network with others, but the benefit of doing so is not observed in our correlation analysis, at least to the citations to their paper.
One could have noticed the fourth SpotME feature, business cards exchanges, is rarely used and then mostly only for !AOSP. It has either no influence on the analysis, or a different effect as the Spearman’s rho on the full paper citations. Possibly the amount of these samples collected from the SpotMe device was not enough for a strong statistical analysis.
This study is a first attempt to analyze this corpus of data and there were omissions: as the data set is a join of three different data sets (SpotMe data, conference registration, and citation data) we investigated the intersection of these three sets and communication inside and outside this intersection, but not (yet) all possible combinations between other intersections of, for instance, SpotMe data and citation data only and others sets respectively–to avoid a combinatorial explosion. Also, a paper appearing both as full paper and as video paper was treated special: since no citations could be obtained for the two instances individually, we counted the citations for the full paper instance and zero citations for the video paper instance, while leaving the joined SpotMe data in place for both instances.
VII. Conclusion
The combination of SpotMe data and bibliometrics obtained from the conference proceedings, yielded good results: social activity during the conference is significantly correlated with citation counts for full papers – and in this case, a positive correlation could be observed. However, it is important to note that it matters who one talks to. From the analysis it becomes clear that the participants of scientific conferences should not spend too much of their social efforts on sticking with their co-authors, but instead with other people. So: One should not spend precious conference time on people one knows very well, especially one’s co-authors, but on getting to know the others, or one’s paper will be less cited.
As the conference data set is much richer than what was reported on in this paper, there will be follow-up studies about more specific interaction patterns and more differentiated conference participants behavior on the one hand, and relating this to more extensive scientometrics such as the development of participants’ h-index over time.
The results of this study do not only have an impact for researchers as the guests of a scientific conference, but also for the organizers of such professional events as the facilitators of academic discourse and networking. By making a scientific conference a great venue to meet new(!) peers and talk about each other’s research, the overall and sustained conference experience can be boosted, which is a strong factor in the decision whether to come back for the successor conference.
VIII. Acknowledgements
We would like to thank the participants of the INTERACT2003 conference for their willingness and efforts in familiarizing with and using the SpotMe devices, as well as the organizers of this event and the SpotMe company for kindly providing us with registration data. We would also like to thank Zheng Joyce Wang from School of Communication, The Ohio State University, for her comments on the early draft of this paper and her insights into the future research.
IX. Appendix: Descriptivies
Table 4: Data related to all papers (N=213)
Min |
Max |
Mean |
Std. Dev. |
Skewness |
Kurtosis |
|
Citations |
0 |
275 |
15.20 |
34.603 |
4.859 |
27.696 |
AOSP present at the conference |
1 |
5 |
1.42 |
.686 |
1.892 |
4.388 |
Messages sent among AOSP |
0 |
36 |
.67 |
2.881 |
9.343 |
108.434 |
Messages sent to !AOSP |
0 |
302 |
7.48 |
29.274 |
9.521 |
93.769 |
Looking for AOSP |
0 |
21 |
1.23 |
3.565 |
3.310 |
11.072 |
Looking for !AOSP |
0 |
214 |
15.43 |
25.149 |
4.183 |
23.865 |
Spotting AOSP |
0 |
13 |
.82 |
2.371 |
3.352 |
11.164 |
Spotting !AOSP |
0 |
113 |
10.31 |
15.667 |
3.349 |
14.119 |
Business card exchanges with AOSP |
0 |
5 |
.13 |
.542 |
5.286 |
34.830 |
Business card exchanges with !AOSP |
0 |
16 |
1.50 |
2.310 |
2.666 |
9.923 |
Total amount among AOSP |
0 |
66 |
2.85 |
8.377 |
4.012 |
19.928 |
Total amount with !AOSP |
0 |
499 |
34.71 |
60.782 |
5.069 |
32.423 |
Total amount of all |
0 |
499 |
37.56 |
62.890 |
4.633 |
27.692 |
Table 5: Data related to full papers (N=82)
Min |
Max |
Mean |
Std. Dev. |
Skewness |
Kurtosis |
|
Citations |
1 |
13 |
3.22 |
1.839 |
2.364 |
9.185 |
AOSP present at the conference |
1 |
5 |
1.28 |
.634 |
3.269 |
14.448 |
Messages sent among AOSP |
0 |
36 |
.70 |
4.075 |
8.280 |
71.842 |
Messages sent to !AOSP |
0 |
298 |
8.65 |
33.074 |
8.487 |
74.801 |
Looking for AOSP |
0 |
19 |
1.23 |
4.016 |
3.300 |
9.821 |
Looking for !AOSP |
0 |
110 |
13.23 |
17.200 |
2.844 |
11.878 |
Spotting AOSP |
0 |
13 |
.80 |
2.696 |
3.431 |
10.761 |
Spotting !AOSP |
0 |
78 |
8.78 |
11.756 |
3.115 |
14.322 |
Business card exchanges with AOSP |
0 |
2 |
.09 |
.391 |
4.599 |
20.147 |
Business card exchanges with !AOSP |
0 |
12 |
1.55 |
2.138 |
2.358 |
7.246 |
Total amount among AOSP |
0 |
66 |
2.82 |
9.890 |
4.478 |
22.774 |
Total amount with !AOSP |
0 |
487 |
32.21 |
57.760 |
6.264 |
48.191 |
Total amount of all |
0 |
487 |
35.02 |
60.152 |
5.534 |
39.619 |
Table 6: Data related to short papers (N=59)
Table 7: Data related to the rest (N=72)
Min |
Max |
Mean |
Std. Dev. |
Skewness |
Kurtosis |
|
Citations |
0 |
23 |
1.78 |
4.098 |
3.588 |
13.710 |
AOSP present at the conference |
1 |
4 |
1.61 |
.797 |
1.169 |
.703 |
Messages sent among AOSP |
0 |
7 |
.71 |
1.631 |
2.351 |
4.604 |
Messages sent to !AOSP |
0 |
38 |
5.33 |
7.371 |
2.711 |
9.051 |
Looking for AOSP |
0 |
21 |
1.83 |
4.073 |
2.526 |
6.866 |
Looking for !AOSP |
0 |
214 |
17.97 |
30.831 |
4.310 |
23.610 |
Spotting AOSP |
0 |
13 |
1.18 |
2.639 |
2.503 |
6.305 |
Spotting !AOSP |
0 |
113 |
11.96 |
18.497 |
3.377 |
13.927 |
Business card exchanges with AOSP |
0 |
5 |
.26 |
.787 |
3.947 |
18.834 |
Business card exchanges with !AOSP |
0 |
11 |
1.51 |
2.207 |
1.864 |
4.012 |
Total amount among AOSP |
0 |
44 |
3.99 |
8.735 |
2.464 |
6.327 |
Total amount with !AOSP |
0 |
332 |
36.78 |
53.928 |
3.341 |
13.903 |
Total amount of all |
0 |
332 |
40.76 |
57.765 |
3.086 |
11.436 |
References
2. Pentland, A. and S. Pentland, Honest signals: how they shape our world. 2008: The MIT Press.
14. Glasman, L.R. and D. Albarracín, Forming attitudes that predict future
