User Experience Evaluation of a Distributed Interactive Movie
Abstract
The effect of presenting a distributed interactive movie at different levels of control and distribution on the end user’s fun and presence experience was studied. The results suggest that an increased level of end-user control on the flow in the video increases the level of the user’s experience and impacts the feeling of presence significantly. The effects of distribution are less clear and are very much depending on the presentation devices and the content modality. These results are discussed in terms of the measurement instruments and the experimental design, and suggestions are made for further research.
2 DeepSea Adventure
3 Measurements
4 Experiment and Results
5 Discussion
6 Concluding remarks
Acknowledgment
References
1 Introduction
This study was conducted in the framework of one of the applications that was developed by the ICE-CREAM (2003) project , an IST project sponsored by the European Commission (IST-2000-28298) in which ten international partners participated. The overall project goal was to investigate how to make compelling experiences for end-users based on enabling technologies and new multimedia standards, such as DVB-MHP(Declerck, 2004), Internet , 3D Graphics, MPEG-4(Koenen, 1999), and SMIL(Slowinski et al., 2001). The goals of the ICE-CREAM project were to extend the notion of interaction, to exploit domestic activities and familiar settings, and to make the user environment part of the experience.
The multimedia standards mentioned above push new interaction technologies forward. The user may interact with the media content using various input methods, such as speech, touch screens and game pads. The classic passive TV watching can be turned into an interactive free exploration, but also intermediate levels of interactivity are possible. All these interactivity levels differ on how much control the user has on the media content. The effects that these different levels of control might have on the user’s entertainment experience are not fully understood. These new interactive media technologies provide new possibilities with regard to distribution of content and level of control for end-users. Distributed devices and sensors may confront the user with a multitude of media presentations and control possibilities. Instead of watching a movie on a single TV, the user now can experience a story on multiple displays and even the lights in the room can react to the events in the story. The effect of such a distributed media presentation on the users is still not completely clear.
Aspects of these technologies were synthesized into a prototype system called “DeepSea Adventure”. The technical implementation of these technologies and the prototype are described elsewhere(Hu and Feijs, 2003; Feijs and Hu, 2004). This study focuses on effects that these technologies have on the users’ entertainment experience.
The definition of a user’s experience is currently still under heavy debate. We adapt Karat’s definition of an entertainment experience as being the experience people are voluntarily going through for pleasure and fun in an entertainment activity(Karat et al., 2001). Hoonhout (2002) identified seven constructs that are important for and related to the fun experience: enjoyability, attention, curiosity, presence, situational factors and pride. Presence is a more widely used construct and several validated measurement tools are available for it.
In this context, we addressed the following questions:
- What influence does the distribution of media presentation have on the user’s fun and presence experience?
- What influence does the level of control have on the user’s fun and presence experience?
We conducted an experiment to address these questions. Before explaining the experiments in detail we will first describe the prototype system that formed the base upon which the experiments were conducted. The content of this prototype contained a deepsea adventure movie that could be viewed in different ways. The prototype included interactive content and the necessary presentation and sensing technology that were used to design the conditions for the experiment.
2 DeepSea Adventure
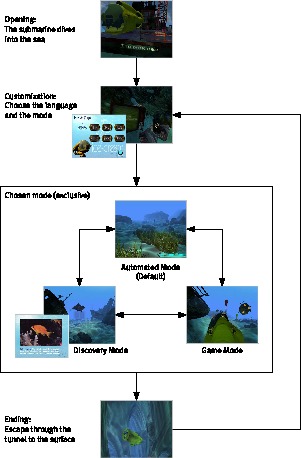
The DeepSea Adventure prototype is a distributed interactive movie developed by de pinxi (2003) and Philips Research. The movie presents an underwater virtual space for the user to explore. The movie starts with a submarine sailing on a sea and after a while diving into the deep sea. When the submarine reach the sea bed, the user will find a small TV set with a message that helps the user to customize the presentation. The user may select a presentation language (English, Dutch or French), and a presentation mode. There are three presentation modes:
- Automated mode:
- This is also the default mode if the user does not select mode within a time limit. In this mode, the presentation becomes a traditional TV program that presents the underwater scenery. The submarine moves slowly in the space following a scripted route. The user will see different kinds of fish, weeds, shipwrecks and landscapes. This mode lasts for 30 seconds.
- Game mode:
- This mode allows the user to move the submarine in two directions, left and right, to navigate the 3D space following the scripted route. The submarine drives ahead in a fixed speed and the user does not have all the freedom to move the submarine around. The user will get a score reward by avoiding obstacles and mines in the route by maneuvering the submarine to the left or right. When a mine is hit, the movie shows explosion with surrounding sounds, lighting effects and vibration effects in the surrounding room. The user will get a final score that correlates to the performance of avoiding the mines and the time used to reach the end. This mode lasts for 30 seconds.
- Discovery mode:
- This mode allows the user to freely navigate the 3D space by controlling both the direction (left, right, up and down) and speed of the submarine (acceleration and brake). With higher freedom of navigation, the user may explore the space, looking for more details of an interested object. The user may also “collect” fishes by driving the submarine closely enough to “catch” them. Detailed information about the caught fish is displayed on another portable display. Hitting a mine will trigger the same effects as in the Game mode, but there is no score reward for avoiding the mines and obstacles. This mode lasts for maximum 4 minutes.
Then the movie shows the selected mode with the first person view of the the 3D space from the submarine, during which the user may always switch to another mode. The user can also stop the selected mode, or watch and play until the time limit has been reached. At the end, the submarine floats back to the surface through a tunnel, after witch a graphical interface is shown so that the user may decide whether to start the movie over again. The content structure is shown in figure 1 .
The prototype utilizes the object oriented features of MPEG-4 to create the 3D virtual space with multimedia objects, such as multiple video and audio streams, 3D graphics, still pictures and text. It also includes lighting effects, graphical interfaces and vibrations as multimedia elements that are distributed over multiple devices (table 1 ) and synchronized using the SMIL timing module (Slowinski et al., 2001). The prototype is build upon on a Linux PC which simulates a DVB-MHP platform.
3 Measurements
We want to know how the user’s entertainment experience is influenced by the features offered in the DeepSea movie, i.e., the distribution of interactive content elements over devices, different levels of interactivity, and the cooperation of multiple users. Before we make any sensible measurements, we need to understand the constructs of the entertainment experience and make them measurable.
3.1 Fun and Presence
What is entertainment in the first place? Literally, entertainment is an amusement or diversion intended to hold the attention of an audience or its participants. Langer (1977) described entertainment as being “any activity without direct physical aim, anything people attend to simply because it interests them”, while citing Whitehead’s similar definition of entertainment as “what people do with their freedom”. Secondly, what is experience? Over the last years, in the field of human-computer interaction and interaction design, many agree that the user experience matters, but with so many definitions of “experience” that it becomes a buzzword. Among these definitions, there are basically three different ways of talking about “experience” (Forlizzi and Ford, 2000):
- experience as the constant stream that happens during moments of consciousness,
- experience as a story to condense, to remember and to communicate with others, and
- experience that has a beginning and an end, and affects the user and the context as a result.
The last one seems more appropriate for our purpose.
We do not want to go beyond these definitions in this paper. For our application, we may define entertainment experience as the experience people are voluntarily going through for pleasure and fun in an entertainment activity (Karat et al., 2001). This gives us the direction for the experience evaluation. The evaluation of the entertainment experience in the context of the Deep Sea Adventure is narrowed down to a matter of whether the user enjoys the movie and has fun.
Fun is a multidimensional construct. Hoonhout (2002) identified seven different factors that are considered to be important for and related to the fun experience, based on the taxonomy by (Malone and Lepper, 1987), the factors that contribute to pleasure in using consumer products (Jordan, 1998), and the flow experience (Csikszentmihalyi, 2000, 1991). Although these factors are not orthogonal and they contribute to each other, they provide us with a closer and more detailed view into the fun experience:
- Enjoyability:
- The degree of enjoyment that users reach when they are voluntarily undergoing an experience that interests them and gives them some amount of pleasure or release.
- Attention:
- Attention is the degree to which a person focuses on the presented media content. It is a cognitive process of selectively concentrating on one thing while deliberately ignoring other things.
- Challenge:
- Levels of challenge are considered to be high in the media contents that stimulate people to think and where the outcome is uncertain.
- Curiosity:
- The tendency of people to seek for something novel. It is a condition for sustained interest and a pre-requisite for people to focus their attention. Sensory curiosity involves, for example, attention-attracting variations and changes in the light, sound or other sensory stimuli of an environment (Malone and Lepper, 1987).
- Control:
- The degree to which the users feel at ease and in control in the environment where the entertainment takes place.
- Pride:
- The degree to which the users feel proud of possessing of the system or consider it for the future use.
- Presence:
- Presence is often referred to as a subjective experience of being in one place or
environment, even when one is physically situated in another. It is an illusion of “being
there”, “it is here” or “being together” (Slater et al., 1996; Witmer and
Singer, 1998; Schuemie et al., 2001). Lombart and Ditton (1997) defined
presence in a more general sense as “the perceptual illusion of nonmediation”. Freeman et al. (2001) identified 4 factors that are related to the presence
experience:
- Spatial Presence, a feeling of being physically located in the virtual space;
- Engagement, a sense of involvement with the narrative unfolding within the virtual space;
- Ecological Validity, a sense of the naturalness of the mediated content;
- Negative Effects, a measure of the adverse effects of prolonged exposure to the immersive content.
The presence experience can be influenced by the extent and fidelity of sensory information, match between actions and reactions, the content and the user characteristics (Freeman et al., 2001). The extent and fidelity of sensory information refer to the ability of a technology to produce a sensorial rich mediated environment. Lombart and Ditton (1997) refer to it as the ‘media form”, and these formal characters are those that involve sensory richness and vividness. These variables are for example the number and consistency of the sensory outputs, visual and aural presentation characteristics, and stimuli for other senses.
According to this understanding, the Deep Sea Adventure has many features that might contribute to presence. The distribution of the content using multiple displays and lamps can be seen as a media form that could enrich the sensory output; synchronized ambient lighting effects build a bridge between the virtual and the real, and hence may blur the boundary of “being there” and “being here”; the system reactions are not bounded by the user’s action space, but extended to the surrounding environment; manipulating the objects in the 3D virtual space introduces increased interactivity and may give the user more feeling of in-control. Would these features bring more sense of presence as expected, and would the distribution unfortunately break down the user’s illusion?
We need appropriate measurement instruments to evaluate the contribution of these features to the fun experience, and among other factors, presence in particular.
3.2 Questionnaires
Two instruments were used: 1) The Appeal questionnaire from Philips Research (Hoonhout, 2002) covers all the fun factors mentioned above. 2) The Television Commission Sense Of Presence Inventory (ITC-SOPI) from the UK Independent Television Commission (Lessiter et al., 2001; Freeman et al., 2001) addresses the Presence factor. We also conducted structured interviews after the participants had finished the experiment and questionnaires.
The Appeal questionnaire was derived from a questionnaire that is being developed in Philips Research for measuring the degree of enjoyability and fun that media content or consumer electronic products provide for the end users. The original questionnaire was in Dutch and it was translated into English for our multinational participants. We used six factors of this questionnaire: Enjoyablity (11 items), Attention (7 items), Challenge (5 items), Curiosity (2 items), Control (4 items), and Pride (4 items) And, in addition, we used the ITC-SOPI questionnaire which is dedicated to assess the Presence factor. The ITC-SOPI is one of the few validated questionnaires for measuring the presence experience of both interactive and noninteractive media. From the original ITC-SOPI questionnaire, we selected 15 items that are considered most applicable (Freeman et al., 2001): Spatial Presence (9 items), Engagement (2 items), Naturalness (1 item), and Negative Effects (3 items). Although Freeman et al. (2001) suggested that one could not combine the scores for each factor into one overall “media experience”, analyzing these factors separately can provide a good insight into the presence experience.
4 Experiment and Results
We conducted a 3× (Level of Control) × 3 (Distribution) mixed between/within experiment. Level of Control was the within participant factor and had the conditions low (LowControl), medium (MediumControl) and high (HighControl). Distribution was the between participant factor and had the conditions None (NoneDistribution), Lighting (LightingDistribution) and Second Display (DisplayDistribution). Due to practical reasons and availability of appropriate video content, the Distribution factor was limited to NoneDistribution in the LowControl condition, to LightingDistribution in the MediumControl condition and to DisplayDistribution in the HighControl condition (see table 2 ).
4.1 Participants
Eighteen post-graduate students (9 males, 9 females) from various backgrounds participated in this experiment, nine Dutch, four Ukrainians, two Belorussians, and one Chinese, French and Russian each. 50% of the students had a background in behavioral sciences and the rest in engineering or natural sciences. The average age was 26 years, ranging from 23 to 30 years. The participants on average watched one to two hours TV per day. Most of them had experience with playing video games and about half of them frequently played games (once or twice a month). They were rather unfamiliar with 3D movies or virtual reality applications.
4.2 Setup
The presentation modes in the DeepSea Adventure allowed different levels of control. We used the Automated mode for the LowControl condition, the Game mode for the MediumControl condition, and the Discovery mode for the HighControl condition. The possibility of switching between different modes during a presentation mode was disabled. In order to catch the effects of distributed lighting, the secondary display were removed from the environment in the MediumControl/LightingDistribution condition. In order to catch the effects of multiple displays, the lighting effects are disabled in the HighControl/DisplayDistribution condition. In all NoneDistribution conditions, only the GamePad was used by the user for interacting with the movie, the secondary display was removed and the lighting effects are disabled. In case the secondary display was needed for starting or customizing the presentation, the operation was done by the experimenters. The toy submarine was not used in this experiment.
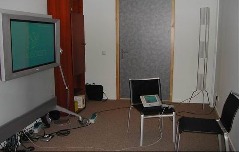
The experiment was conducted in a 4 × 6m2 room at Philips Research Eindhoven. The 42 inches plasma display was placed on the wall and 1.5 meters high from the floor and 3 meters away from the user. When a secondary display was needed, it was placed in front of the user within reach. Except for the four lights controlled by the system, there were no any other light sources used, including the natural light. Figure 2(a) shows the laboratorial setup.
4.3 Procedure
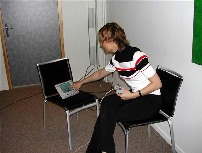
The experiment started with a welcome session and a training movie. The training movie had a similar content, lasted for 3 minutes and allowed the participants to practice all the interaction devices that could be used. Afterwards, they had the opportunity to ask questions about the process of the experiment. Next, the real experiment started, which consisted of the movie with three configurations and two questionnaires after each configuration. The order of the conditions were randomized and counterbalanced. At last, a structured interview was conducted with prepared questions. The whole experimented lasted for about one hour. Figure 2(b) shows a user interacting with the movie in DisplayDistribution/HighControl condition.
4.4 Results
Due to the fragmented nature of the Distribution factor it was not possible to conduct a single analysis of variance (ANOVA) across all conditions. Instead, one ANOVA for the Level of Control factor and two ANOVAs for the Distribution factor were conducted.
4.4.1 Level of Control Effect
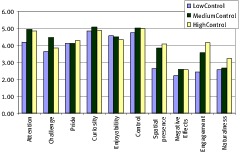
Figure 3 shows the mean scores for all Level of Control conditions.
A 3× (Level of Control) repeated measure ANOVA was conducted. Attention (F(2,16) = 8.54,p = .01), Challenge (F(2,16) = 8.79,p = .01), Spatial Presence (F(2,16) = 34.79,p < .001), Engagement (F(2,16) = 22.2,p < .001) and Naturalness (F(2,16) = 4.96,p = 0.03) were significantly influenced by the Level of Control.
The Attention scores were significantly lower (t(8) = 2.64,p = .03) in the LowControl condition (4.19) than in the HighControl condition (4.84). The Challenge scores were significantly higher (t(8) = 2.94,p = 0.02) in the MediumControl condition (4.49) than in the HighControl condition (3.87). The Spatial Presence scores were significantly lower (t(8) = -6.27,p < .001) in the LowControl condition (2.64) than in the MediumControl condition (3.85). The Engagement scores were significantly lower (t(8) = -4.5,p < .001) in the LowControl condition (2.44) than in the MediumControl condition (3.56). Finally, the Naturalness scores were significantly higher (t(8) = -4,p < .001) in the HighControl condition (3.22) than in the MediumControl condition (2.67).
4.4.2 Distribution Effect
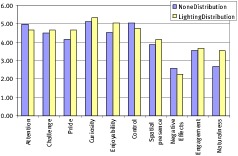
Both groups of participants were in the LowControl condition which enabled us to verify that there were no significant differences between the groups. Therefore, the MediumControl condition functions as the NoneDistribution condition for this analyses. Figure 4(a) shows the mean scores for the NoneDistribution condition and the LightingDistribution condition.
A 2× (Distribution) ANOVA was performed. Distribution had a significant effect on Pride (F(1,16) = 5.92,p = .03), Spatial Presence(F(1,16) = 5.13,p = .04) and Naturalness (F(1,16) = 6.92,p = .02). The Pride scores were significantly lower (t(16) = -2.43,p = .03) in the NoneDistribution condition (4.14) than in the LigthingDistribution condition (4.67). The Spatial Presence scores were significantly lower (t(16) = -2.27,p = .04) in the NoneDistribution condition (3.85) than in the LightingDistribution condition (4.16). The Naturalness scores were significantly lower (t(16) = -2.63,p = .02) in the NoneDistribution condition (2.67) than in the LightingDistribution condition (3.56).
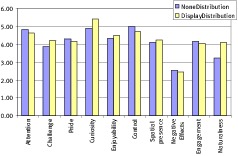
The HighControl condition served as the NoneDistribution condition for the comparison with the DisplayDistribution condition. Figure 4(b) shows the mean scores for the NoneDistribution condition and the DisplayDistribution condition.
A 2× (Distribution) ANOVA was performed. Distribution had a significant effect only on Naturalness (F(1,16) = 12.8,p < .001). The scores for Naturalness were significantly lower (t(16) = -3.58,p < .001) in the NoneDistribution condition (3.22) than in the DisplayDistribution condition (4.11).
5 Discussion
5.1 Level of Control effect
The effects of Level of Control on the user’s presence experience were expected and the significant differences in Spatial Presence, Engagement and Naturalness confirmed our expectations. This also confirms the results from many other studies (Waterworth et al., 2001; Welch et al., 1996; Agah and Tanie, 1999; Regenbrecht and Schubert, 2002). However, Level of Control effects on the measurements in the Appeal questionnaire were less clear. The increase of Attention and Challenge correspond to the findings in the presence questionnaire. The more control the users had, the more difficult the task became.
However, this did not necessarily result in more fun. No significant differences were found for the other Fun concepts. There are two possibly explanations: either there were indeed not many significant effects caused by increased level of control, or these effects were not caught by the Appeal questionnaire. From the results, it seems that the validated ITC-SOPI is more sensitive than the Appeal questionnaire when measuring the effects of the interactivity. This might be because the ITC-SOPI was designed with the consideration of interactive media, while the Appeal questionnaire was originally designed for passive media and traditional consumer electronic produces. Although it was being tweaked for the interactive media and products, it is still under development and validation. The reliability of the results from this questionnaire needs to be verified and possibly to be improved.
5.2 Effects of distribution
Distribution is not a new idea for enhancing the entertainment experience. A good example is the multi channel audio. Over the years, mono sound in early days has been improved to multi channel sound in different levels: stereo (2.0), stereo with bass (2.1), five channel surround (5.0), 5.1 DTS surround (five channels with bass). Recently 6.1 DTS surround (six channels with bass) is appearing in the market. Distribution of the sound makes the experience more compelling and more natural because of the nature of the human multidirectional auditory system. Will the distribution of visual content elements enhance the entertainment experience? Both the lighting effects and the secondary display were used for distributing the visual elements.
We found less than we had hoped for in the results of the questionnaire. Only Naturalness has been affected in both the LightingDistribution condition and the DisplayDistribution condition. This corresponds to previous studies. Lessiter et al. (2001) already suggested that: “The number, extent, and consistency of sensory stimulation (media form variables) are therefore likely to enhance perceived naturalness.” However, the other measurements remained suspiciously unaffected in either direction.
From the interviews, it appeared that the distribution of the visual content could distract attention and the participants felt less at ease and in control. This might be a natural result of any kind of distribution - People have to switch their attention from one device to another especially when the stimuli occupy the same sensory channel. This reminds us to keep in mind that the visual channel of the human sensory is not multidirectional in the same way as the auditory sense. Distribution in vision can be distractive. In design, we should be careful with switching visual attention between action spaces.
The term “displayed environment” appeared in both the Appeal questionnaire and the ITC-SOPI. The participants found it to be difficult to understand especially in the distributed configurations. From the designer’s point of view, both the lighting effects and the content elements presented on the secondary display were a part of the movie, hence a part of the “displayed environment”. It was also stated clearly in the introductions of the both questionnaires that “We use the term ‘displayed environment’ here, and throughout this questionnaire, to refer to the film, video, graphics, the virtual world and the physical effects that you have just encountered”. This statement was from the original ITC-SOPI questionnaire and was revised to adapt to the distributed configurations. It was possibly not stressed enough in our experiments. In the interviews, it was found that some participants only took the 3D virtual world presented by the plasma display as the “displayed environment” and did not consider all the distributed content as a whole. This might have increased the deviations and hence hampered the reliability of the results.
5.3 Content
To observe the effects of the interactivity and the distribution, we tried to keep the content itself as neutral as possible - we wanted to keep the audience not too excited nor too bored by the content itself. We derived the DeepSea Adventure from existing content elements which de pinxi (2003) originally designed for theme parks and a larger audience. We reduced the narrative to a minimal level, that is, there was not really a story plot in the content. From the interviews, this had resulted in low motivation of the participants to interact with the content, and even boredom.
If the content was designed for production, and not for the experimental sake, we should not have done this. The design of content should also be dedicated specifically to the home environment and not be derived from the content for large audience spectacles and theme parks. The motivation of the participants in both settings is quite different. People carefully plan to go to a multimedia spectacle or to a theater, they usually don’t go alone, they don’t leave halfway the show unless it is terribly bad and it is a full evening/afternoon commitment. In contrast, behavior at home is much more spontaneous. People don’t sit through a full program if they don’t like it, they zap, they turn the system off, they make phone calls, they go to the fridge, etc. It takes much more to keep them motivated to stay with the program and to remain enticed to interact with it. The feedback from the interviews showed that it was very important to provide the users with stimuli that motivated them to explore and interact with the content. A clear goal and more opportunities for interaction with objects in the content support these motivational aspects. Support for this finding can also be found in (Malone and Lepper, 1987).
5.4 Experimental Design
The distributed lighting effects and graphical elements on the secondary display were considered as a part of the content, but they were however not present in the basic LowControl/NoneDistribution conditions. This might result in arguments whether the content in different configurations is the same. If not, we actually had introduced another variable in the experiment, that is, besides the interactively and the distribution, we should have also considered the content as a variable, although we tried to keep the content difference between the interaction modes a minimum. We leave this as an option the future research.
5.5 Next steps
Another interesting question we could not answer in this study is to what extent and in which cases the distribution could enhance the entertainment experience. In the case of multichannel audio, Freeman and Lessiter (2001) found that five channels did not provide more presence than two channel stereo. What could it be in other sensory modalities? We are currently working on another project, trying to partially answer this question: to find out the relation between the extent of visual distribution and the presence experience in a more controlled experimental setting.
6 Concluding remarks
We had high expectations for distributing interactive media in an ambient intelligent environment to bring more compelling entertainment experience to end users. We limited our ambitions of measuring the user’s entertainment experience to an operable level, that is, to look at the factors of the Fun experience, and the Presence factors in particular.
These expectations are partially proved to be true in our experimental settings. The increased level of control did have positive effects on the user’s Fun experience, especially had significant impact on the Presence factors. As to the distribution of content elements, the expectations had been lowered by the results from the experiments. The effects were less clear except the Naturalness factor. It also seems to be dependent on the devices to which the content is distributed and the modalities of these distributed content. In our study, distributed lighting seemed to have more positive effects on the user’s Fun and Presence experience than distributed displays.
The evaluation of the DeepSea Adventure provided a lot of valuable feedback, for the next iteration of the design process. The concept was perceived as very promising and interesting by the participants and many said they “liked” it. The evaluation also revealed that we still have a long way to go with regard to the development of methodologies for evaluation, the design of the measurement instruments, the exploitation of the possibilities for interaction with content by users in the home environment, and the exploration of distributing ambiance effects in synchronization with, or as a part of the content.
Acknowledgment
The DeepSea application was developed in the ICE-CREAM project, sponsored by the European Commission (IST-2000-28298). The authors like to thank the partners in the ICE-CREAM project and especially Philips Research and de Pinxi for providing the content and all the facilities, and Loe Feijs and Paul Locher for their comments on the early draft of this paper.
References
Agah, A. and Tanie, K. (1999). Multimedia human-computer interaction of presence and exploration in a telemuseum. Presence: Teleoperators and Virtual Environments, 8(1):104–111.
Csikszentmihalyi, M. (1991). Flow: The Psychology of Optimal Experience. HarperCollins.
Csikszentmihalyi, M. (2000). Beyond Boredom and Anxiety: Experiencing Flow in Work and Play. Jossey-Bass.
de pinxi (2003). Homepage of de pinxi. Available from: http://www.depinxi.be/.
Declerck, C. (2004). Introduction to MHP. Focal Press.
Feijs, L. and Hu, J. (2004). Component-wise mapping of media-needs to a distributed presentation environment. In anonymous, editor, The 28th Annual International Computer Software and Applications Conference (COMPSAC 2004), pages 250–257.
Forlizzi, J. and Ford, S. (2000). The building blocks of experience: an early framework for interaction designers. In anonymous, editor, Proceedings of the conference on Designing interactive systems, pages 419–423. ACM Press.
Freeman, J. and Lessiter, J. (2001). Hear there & everywhere: The effects of multi-channel audio on presence. In Hiipakka, J., Zacharov, N., and Takala, T., editors, ICAD 2001 - The Seventh International Conference on Audio Display, pages 231–234. Helsinki University of Technology.
Freeman, J., Lessiter, J., and IJsselsteijn, W. (2001). An introduction to presence: A sense of being there in a mediated environment. The Psychologist, 14:190–194.
Hoonhout, J. (2002). Development of a rating scale to determine the enjoyability of user interactions with consumer devices. Technical report, Philips Research.
Hu, J. and Feijs, L. (2003). An adaptive architecture for presenting interactive media onto distributed interfaces. In anonymous, editor, The 21st IASTED International Conference on Applied Informatics (AI 2003), pages 899–904. ACTA Press.
ICE-CREAM (2003). The ice-cream project homepage. Available from: http://www.extra.research.philips.com/euprojects/icecream/.
Jordan, P. (1998). Human factors for pleasure in product use. Applied Ergonomics, 29(1):25–33.
Karat, C.-M., Pinhanez, C., Karat, J., Arora, R., and Vergo, J. (2001). Less clicking, more watching: Results of the iterative design and evaluation of entertaining web experiences. In 8th International Conference on Human-Computer Interaction (INTERACT 2001), pages 455–463. IOS Press.
Koenen, R. (1999). Mpeg-4: Multimedia for our time. IEEE Spectrum, 36(2):26–33.
Langer, S. K. (1977). Feeling and Form. Prentice Hall.
Lessiter, J., Freeman, J., Keogh, E., and Davidoff, J. (2001). A cross-media presence questionnaire: The itc sense of presence inventory. Presence: Teleoperators and Virtual Environments, 10(3):282–297.
Lombart, M. and Ditton, T. (1997). At the heart of it all: The concept of presence. Journal of Computer Mediated Communication, 3(2).
Malone, T. and Lepper, M. (1987). Making learning fun: A taxonomy of intrinsic motivations for learning. Aptitude, learning and instruction. Volume 3: Cognitive and affective process analysis. Lawrence Erlbaum.
Regenbrecht and Schubert, T. (2002). Real and illusory interactions enhance presence in virtual environments. Presence: Teleoperators and Virtual Environments, 11(4):425–434.
Schuemie, M., van der Straaten, P., Krijn, M., and van der Mast, C. (2001). Research on presence in vr: a survey. ACM Virtual Reality Software and Technology (VRST), 4(2):335–341.
Slater, M., Linakis, V., Usoh, M., and Kooper, R. (1996). Immersion, presence and performance in virtual environments: An experiment with tri-dimensional chess. ACM Virtual Reality Software and Technology (VRST), pages 163–172.
Slowinski, M., Kennedy, T., and Kennedy, T. (2001). SMIL: Adding Multimedia to the Web. Sams.
Waterworth, E., Waterworth, J., and R., L. (2001). The illusion of being present: Using the interactive tent to create immersive experiences. In anonymous, editor, Presence 2001, The 4th Annual International Workshop on Presence.
Welch, R., Blackmon, T., Liu, A., Mellers, B., and Stark, L. (1996). The effects of pictorial realism, delay of visual feedback, and observer interactivity on the subjective sense of presence. Presence: Teleoperators and Virtual Environments, 5(3):263–273.
Witmer, B. and Singer, M. (1998). Measuring presence in virtual environments: A presence questionnaire. Presence: Teleoperators and Virtual Environments, 7(3):225–240.
